
 Welcome, I am
Christian José
Torrealba Rondón.
Building digital products and solutions through data-driven engineering and user-centered design.
🧩Hobbies

How I Impact Product & Tech Domains

Engineer who integrates product strategy, technical execution, and data analytics.
I help teams connect business needs with technical solutions, translating complex requirements into products that work seamlessly and deliver real value.
Product Direction & Strategy
Aligning business goals with technical execution to accelerate delivery.
Solution Design & Web Development
Delivery of web applications along with design systems, and monitoring cloud infrastructures.
Data-Informed Strategy & Insights
Data architecture and analytics design for business decision-making.
AI Engineering & Automation
Optimizing software delivery through automated workflows and AI integration.
Work Ecosystem
How I integrate my skills and tools into real-world projects.Experience collaborating with teams and people across different countries within Europe and the US.
Formal education and verified credentials supporting technical execution.
V-Shaped Profile
Interact with the nodes to map out key areas
Featured Projects
Key projects delivered in production and presented at conferencesIntegrated System of Opportunity Portfolios (SIPO)
Real-time decision-support system for the oil & gas industry
© Petroleum of Venezuela (PDVSA)Overview
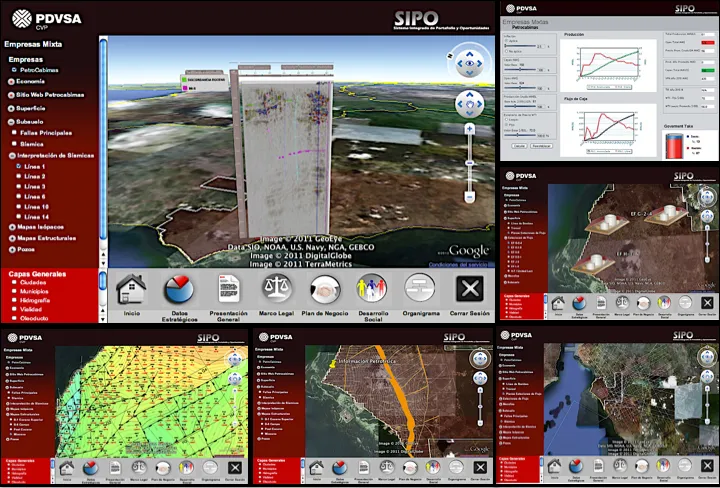
SIPO is a web-based platform designed to support strategic decision-making in the oil industry by centralizing technical, economic and geoscience data into a single source of truth. The system combines interactive data visualizations with geospatial capabilities (Google Earth) to enable real-time economic scenario analysis.
Contribution
Collaborated with a multidisciplinary team of engineers, economists, geologists and geographers to design, develop and launch the platform. Focused on translating complex business and technical requirements into a usable real-time application for executive-level analysis.
Technologies
Key Outcomes
The platform eliminated data redundancy by centralizing previously fragmented technical and geoscience workflows into a single real-time source of truth. It enabled the Board of Directors to perform instant economic simulations, significantly accelerating strategic decision-making and improving collaboration between technical and business teams.
Representation of geographical data related to the Venezuelan Petroleum Industry
Democratizing access to complex geospatial and hydrocarbon data
© Petroleum of Venezuela (PDVSA)Overview
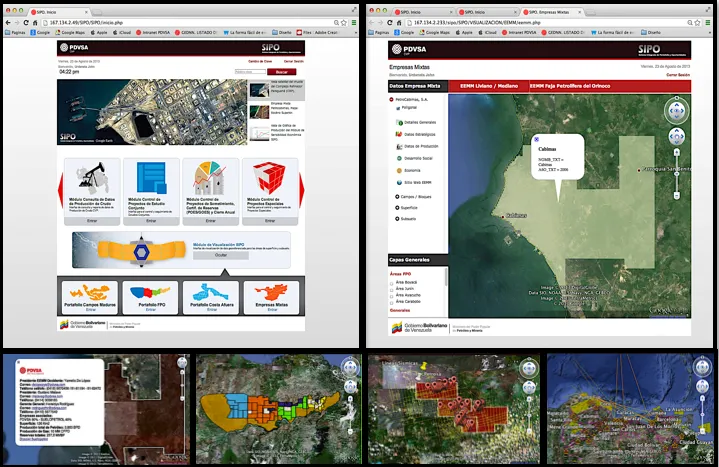
Project focused on simplifying access to large volumes of geographical and hydrocarbon data (oil fields, geological formations and infrastructure) that were traditionally locked behind specialized software such as ArcGIS. The solution automated the generation and management of KML/KMZ files to make this information accessible to broader teams.
Contribution
Worked closely with geologists and geographers to design and implement an automated process for creating and editing KML/KMZ files, removing the dependency on expensive and complex GIS tools for everyday use.
Technologies
Key Outcomes
The solution democratized access to critical petroleum and geological data by automating the generation of KML/KMZ files. This removed the operational dependency on specialized tools such as ArcGIS for everyday visualization tasks and allowed cross-functional teams to work more efficiently with complex geospatial information.
Augmented Intelligence for Data Visualization Analytics
Making complex data insights accessible through AR and conversational interfaces
© SDG GroupOverview
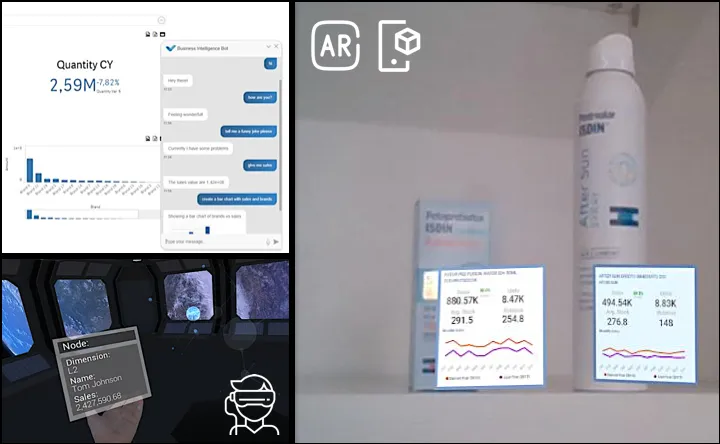
Initiative aimed at democratizing data access by combining Augmented Reality / Mixed Reality experiences with virtual assistants. The goal was to help non-technical users explore large datasets and extract insights in a more intuitive and engaging way.
Contribution
Collaborated with the engineering team to design and build an AR/MR application for visualizing sales trends and a chatbot interface that allowed users to query and explore data through natural interaction, integrated with the Qlik Sense ecosystem.
Technologies
Key Outcomes
The project accelerated data democratization by making complex analytics accessible to non-technical users through Augmented Reality and conversational interfaces. The resulting Analytics Showroom combined Mixed Reality experiences with a virtual assistant, and the solution was presented at the Qlik Qonnections Global Conference as an innovative approach to business intelligence.
Certifications
Explore some of my verified credentials and certifications I can bring to the table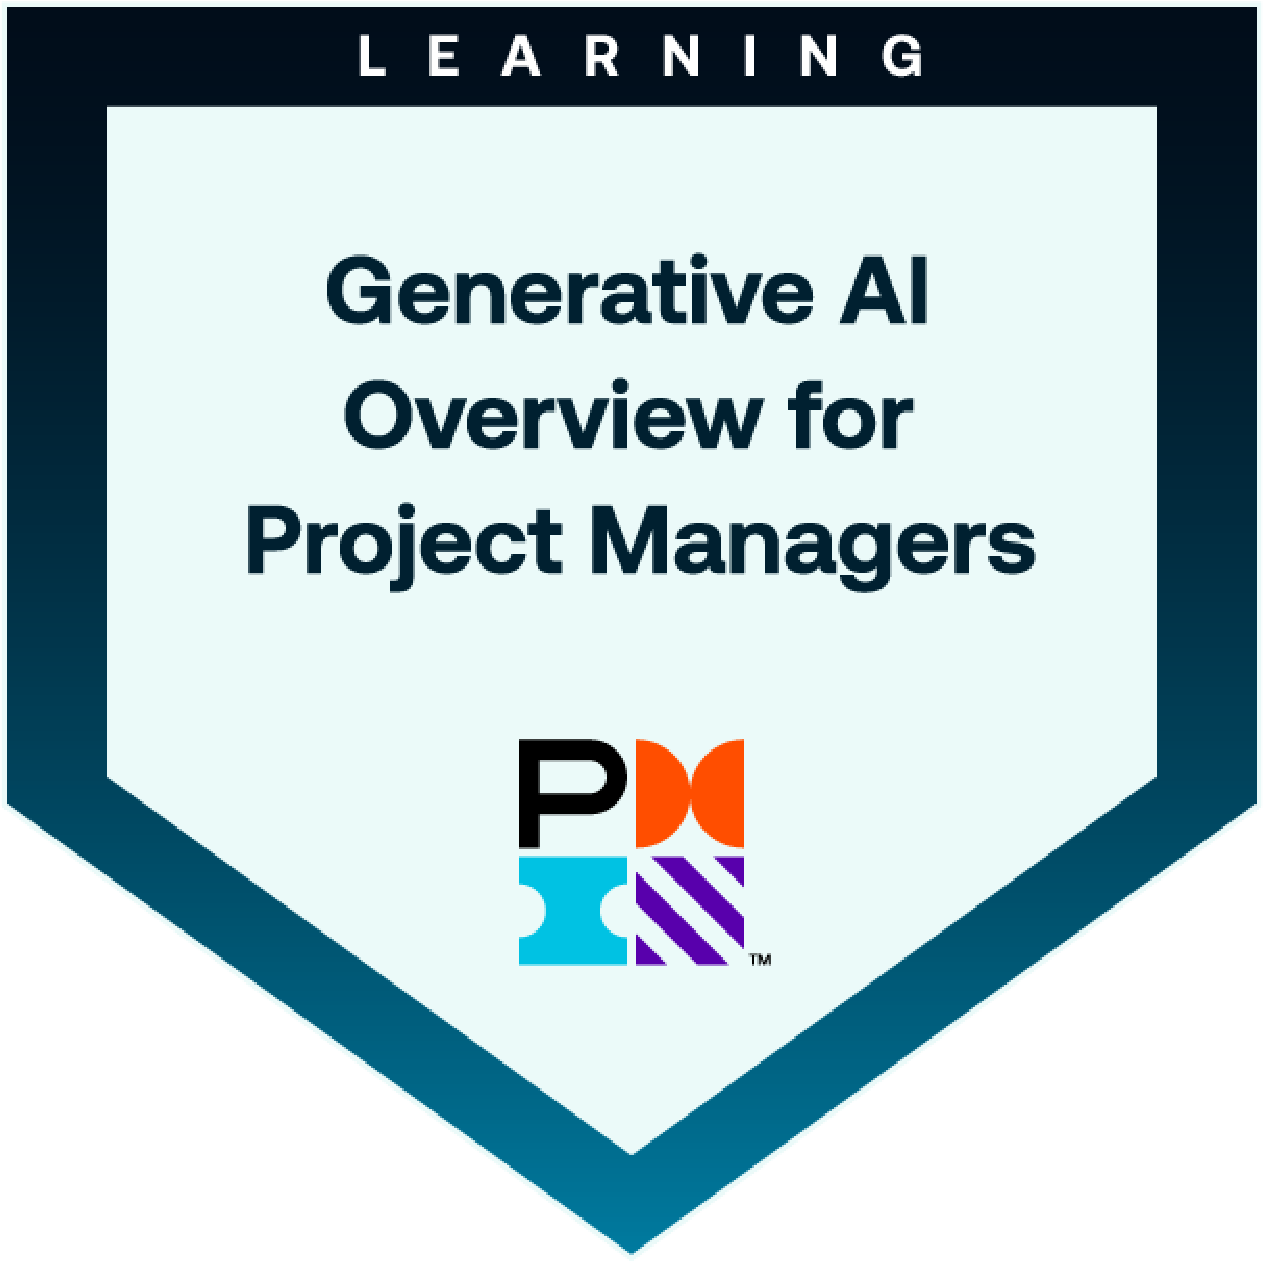







Selected Works
A curated collection of some of my projects and works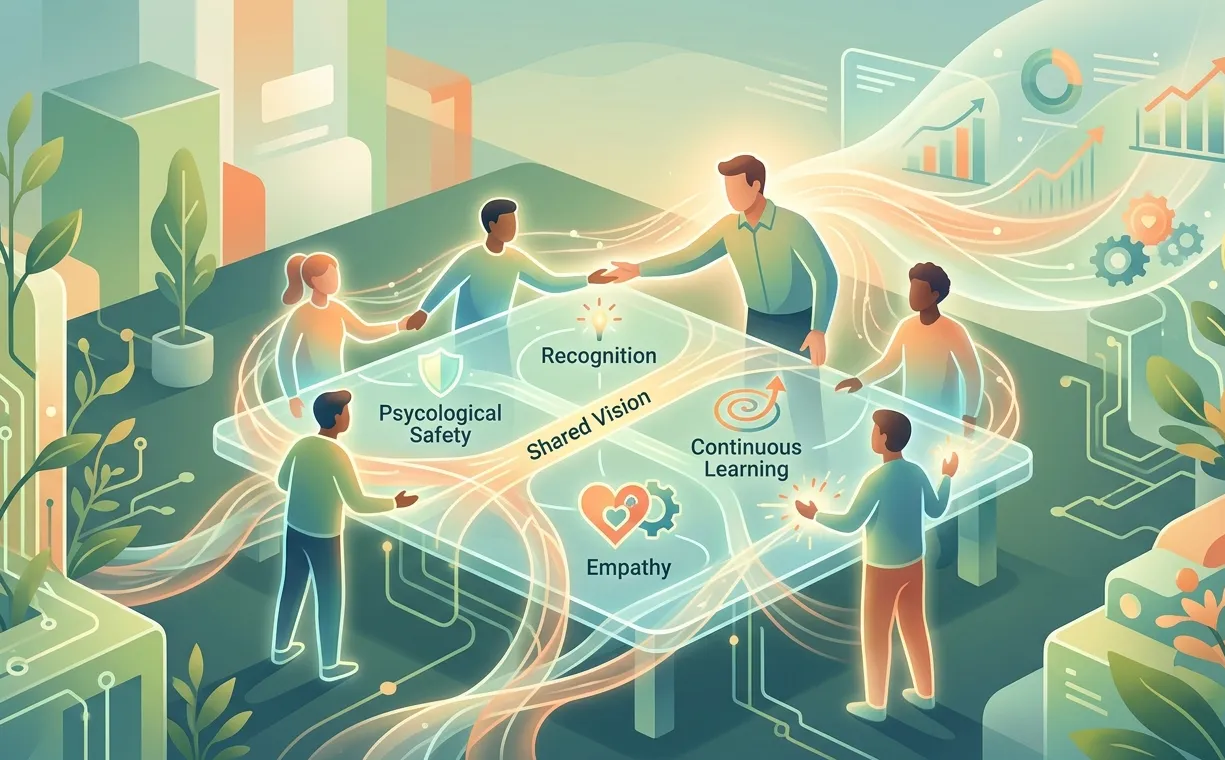
Promoting a healthy culture within engineering teams
Examine the critical role of leadership in fostering a healthy culture within engineering teams. We argue that a technology leader's role extends beyond strategy and implementation to actively promoting a positive work environment.
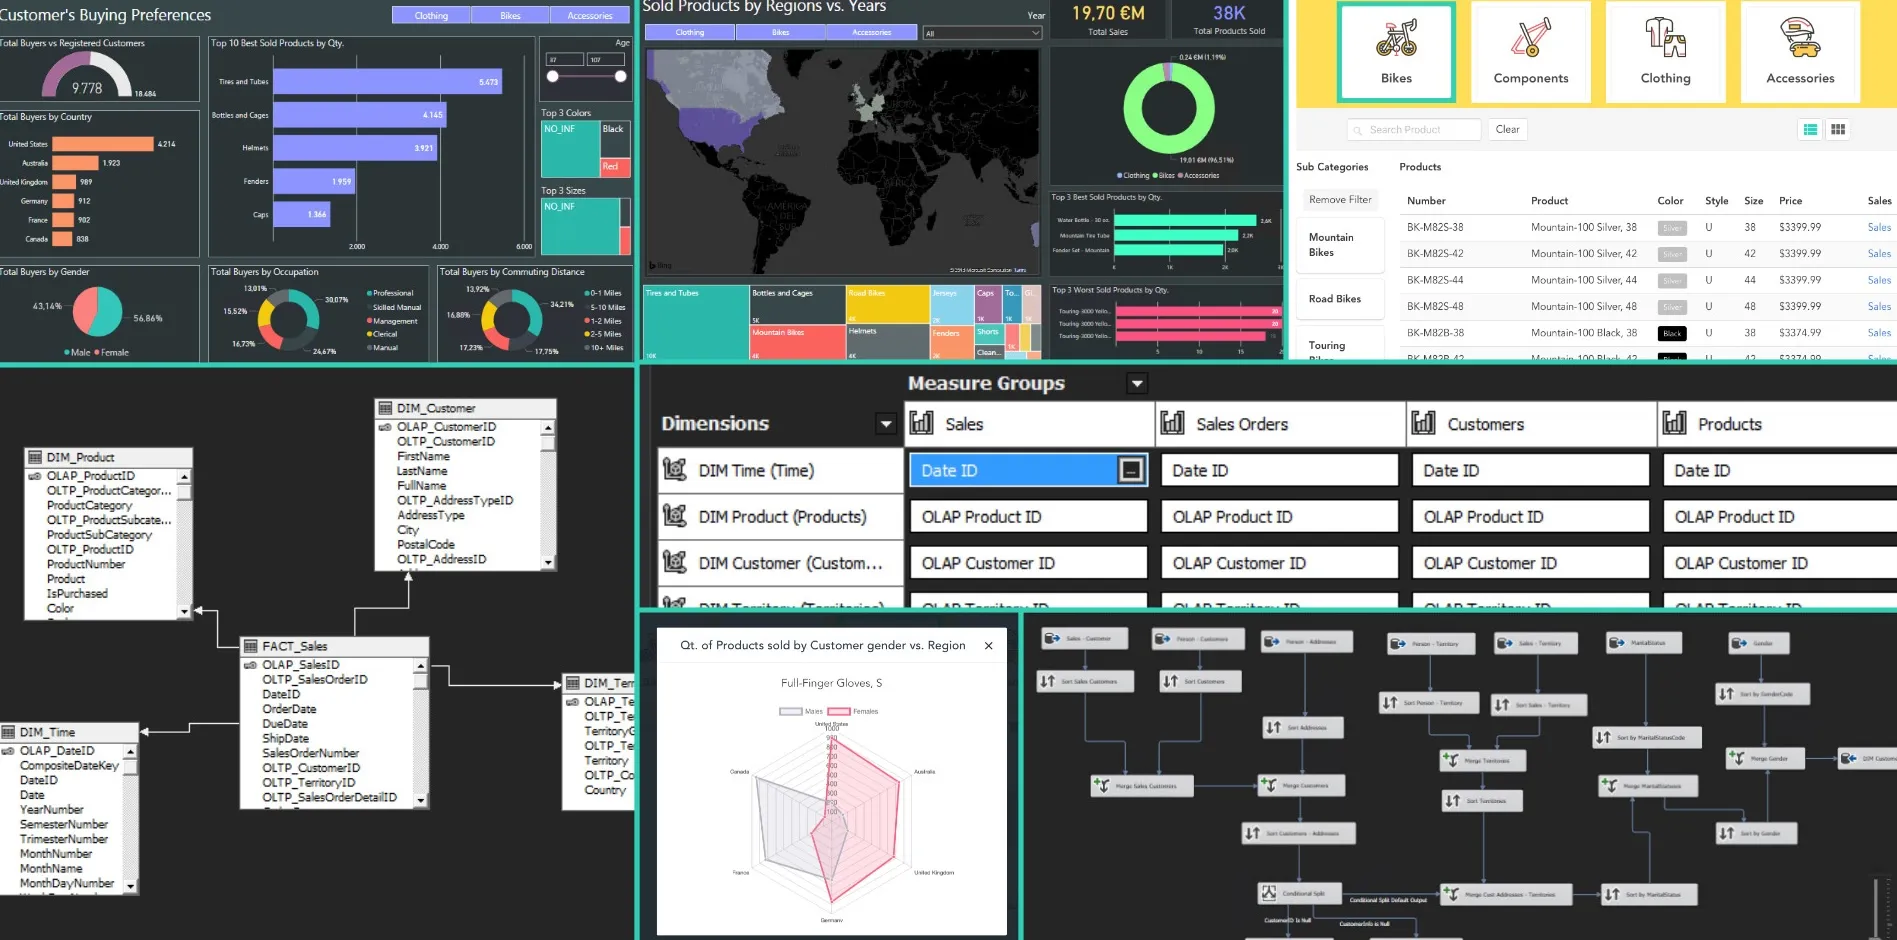
Business Intelligence Enterprise Project: Adventure Works Cycles
Enhance knowledge creation by streamlining data management through the creation of ETL pipelines and data refinement processes. This enables smarter, data-driven decisions supported by a custom web application and dashboards.
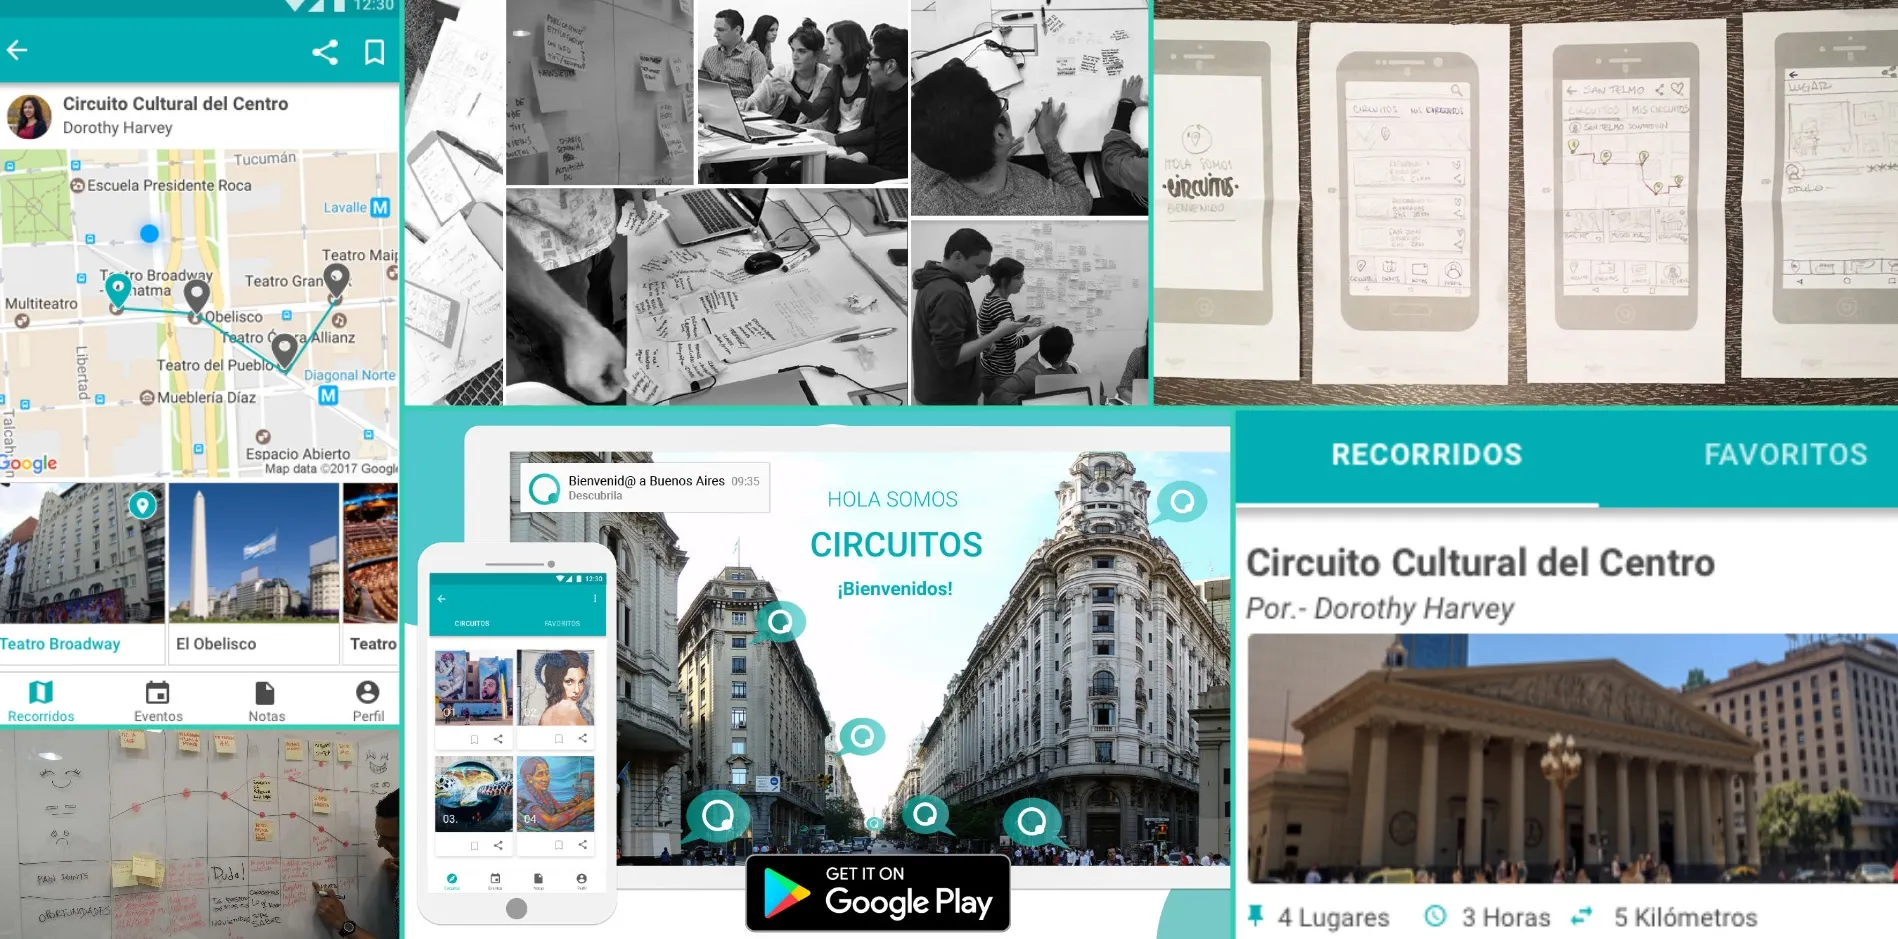
Circuitos: Discover Your Artistic Hub
Discover and share your artistic and cultural interests with a like-minded community. Our platform is a go-to for anyone who wants to explore new experiences and connect with others who love art as much as they do.
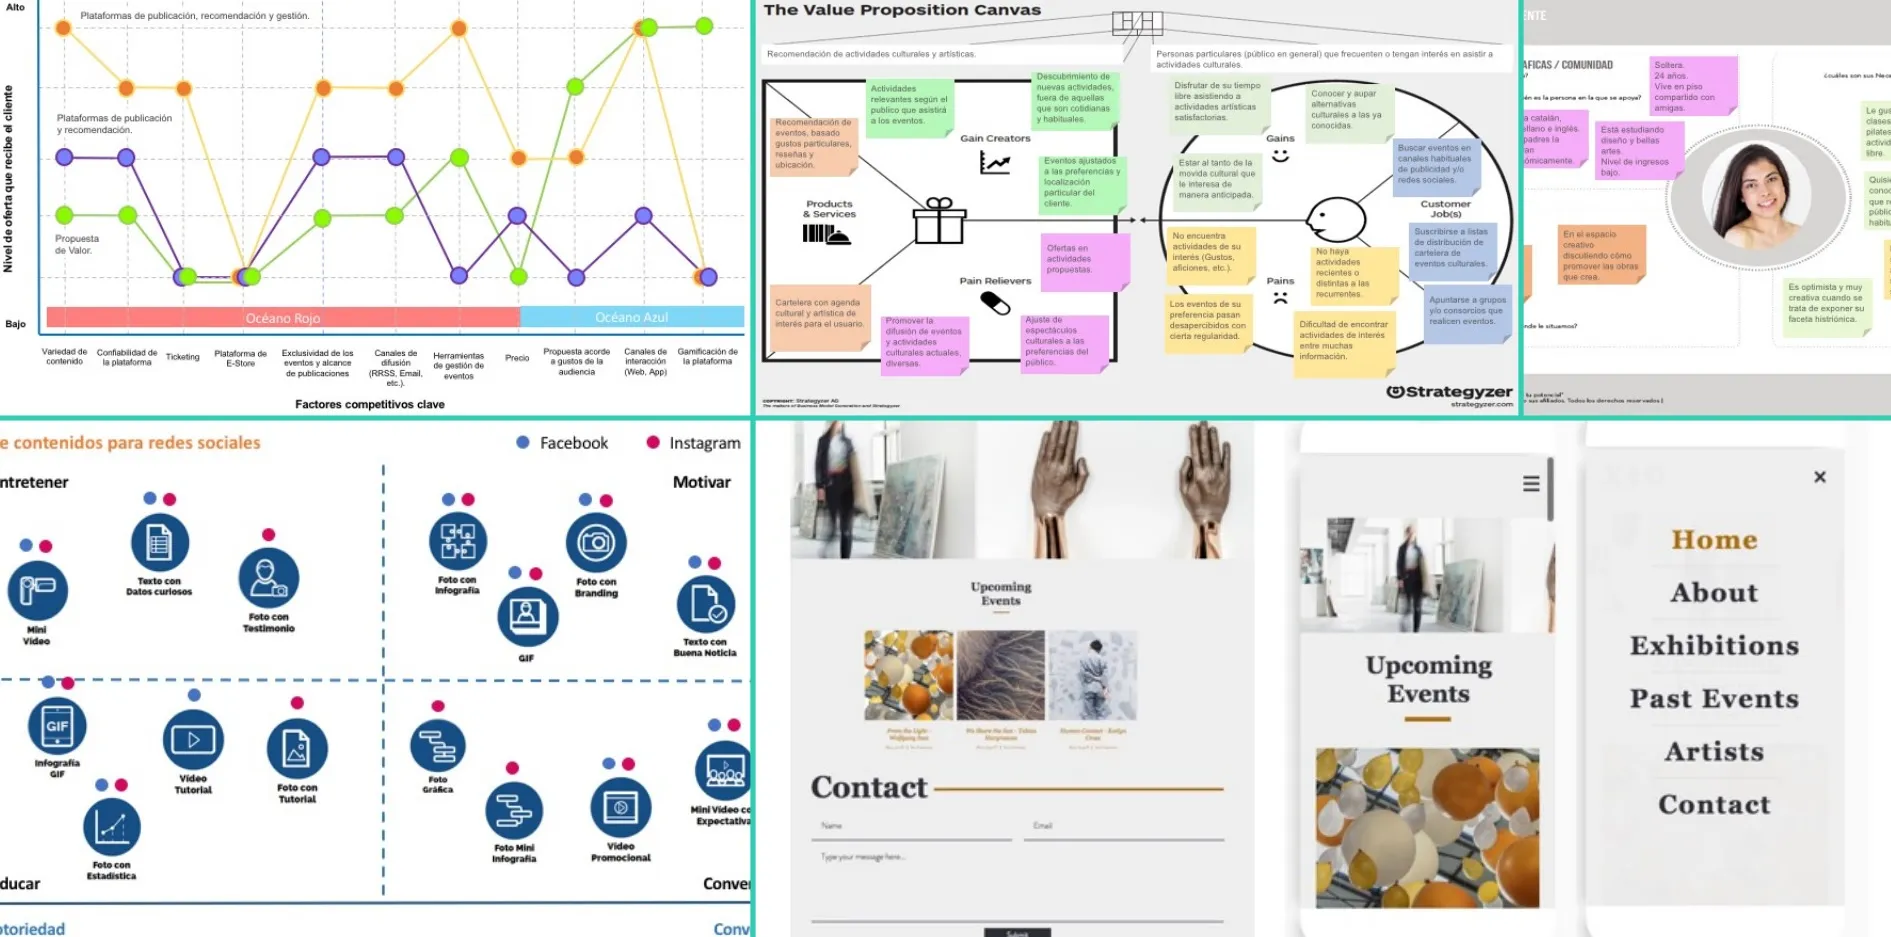
Idea: Application for promoting cultural activities
Platform that helps you find and participate in cultural events by creating a network tailored to your specific preferences. We make it simple to discover and connect with a community of people who share your artistic and cultural interests.
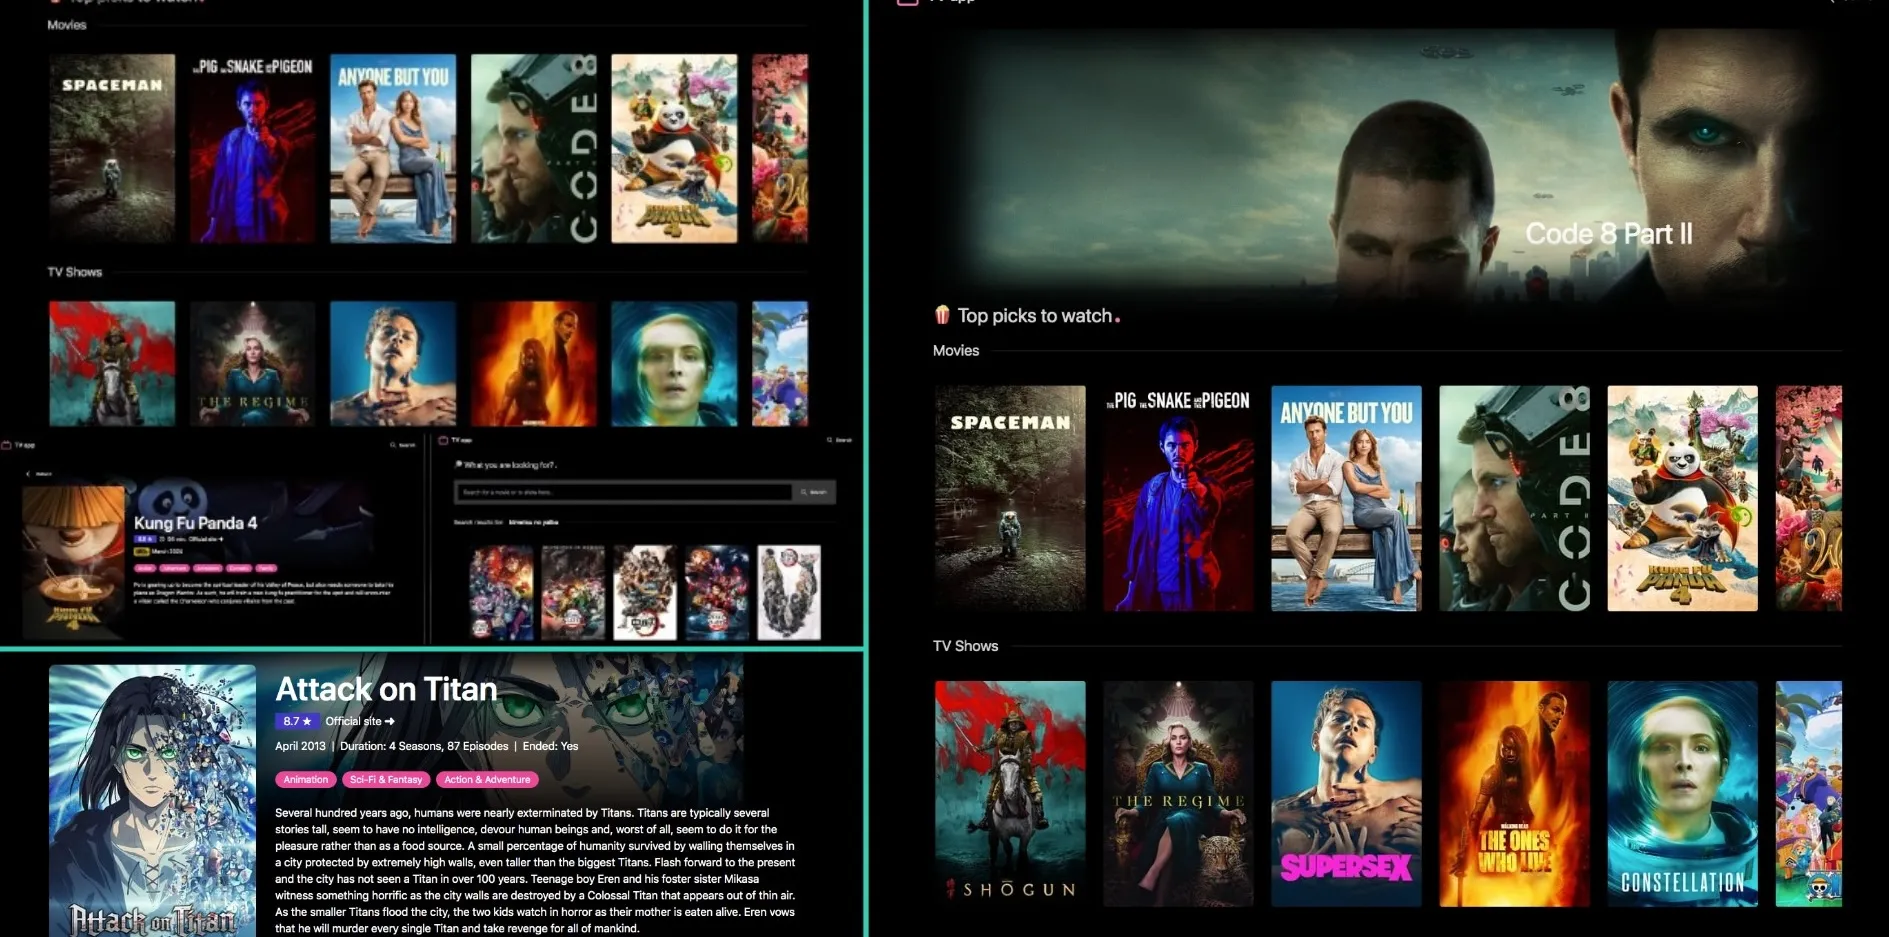
TMDB Web Explorer: Real-Time Movie & TV Series Database
Full-stack web application designed for anyone who loves movies and TV shows. It provides a seamless, fast way to browse a comprehensive catalog of titles, giving you all the details you need in one place. You can explore a wide variety of content through a user-friendly interface.
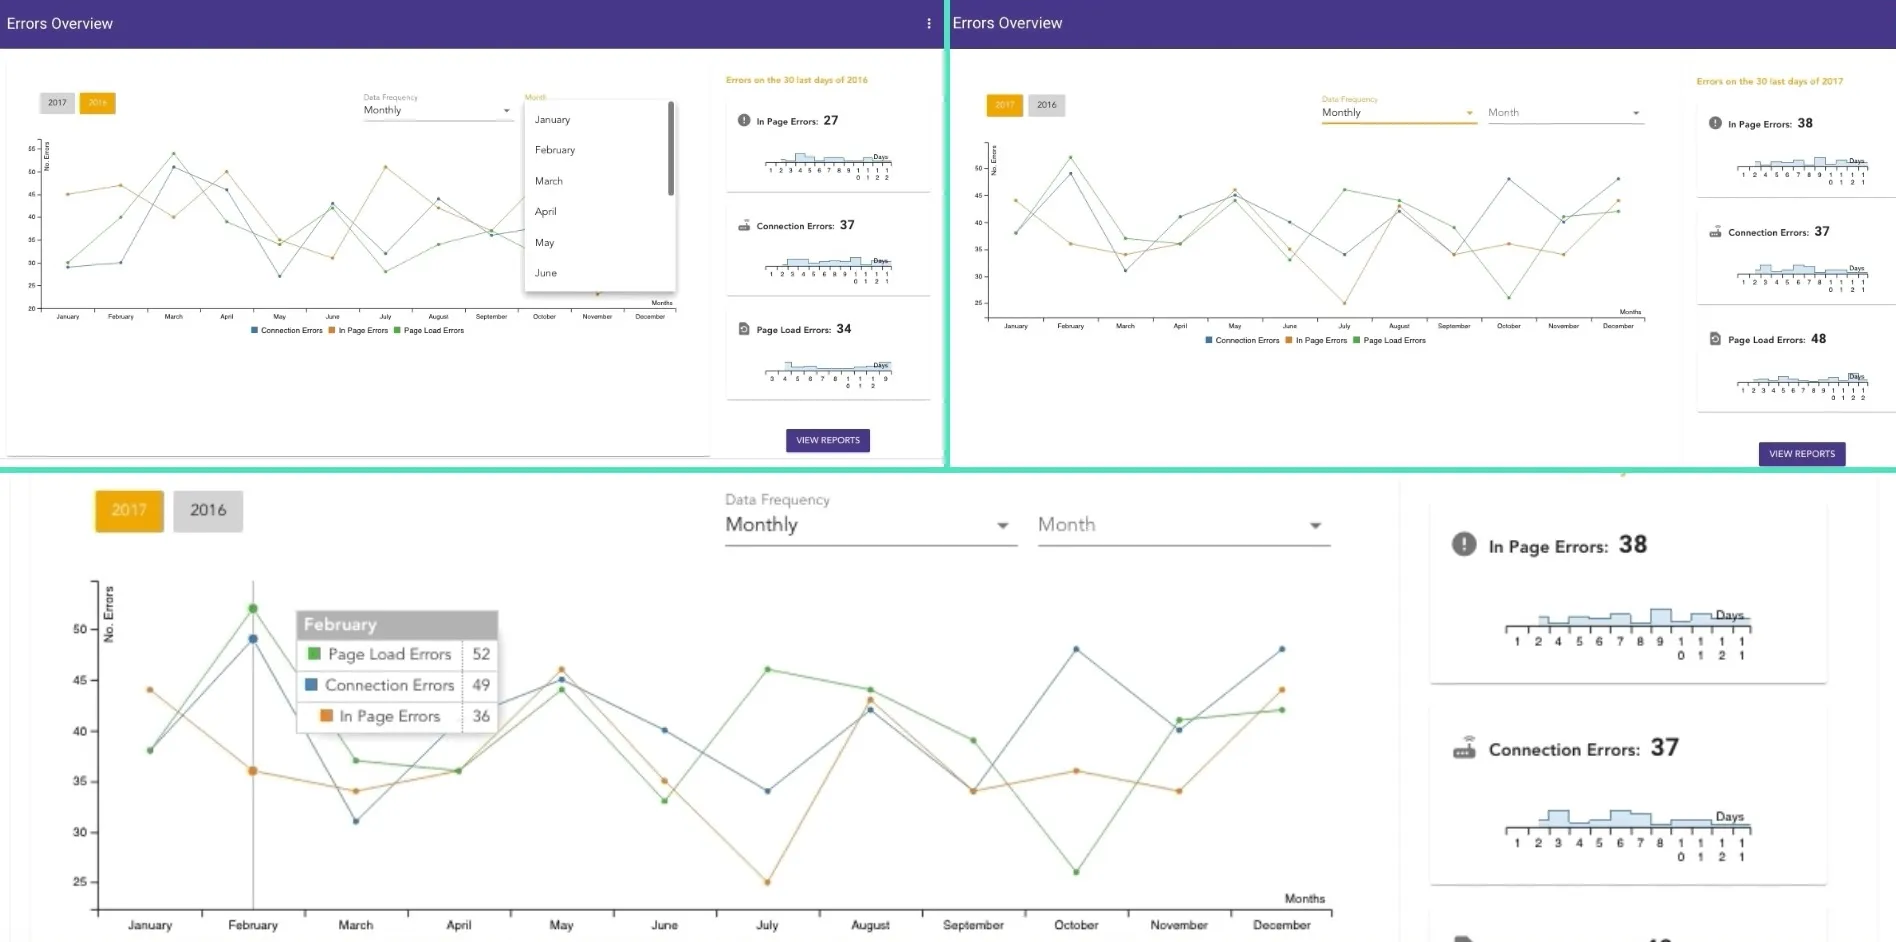
Visualization Dashboard for Monitoring
Web application designed to help you easily understand complex data. Using the powerful D3.js library, it creates interactive and visually engaging charts for a business intelligence dashboard. You can effortlessly switch between different timeframes—by day, week, month, or year—to analyze error reports and other data.
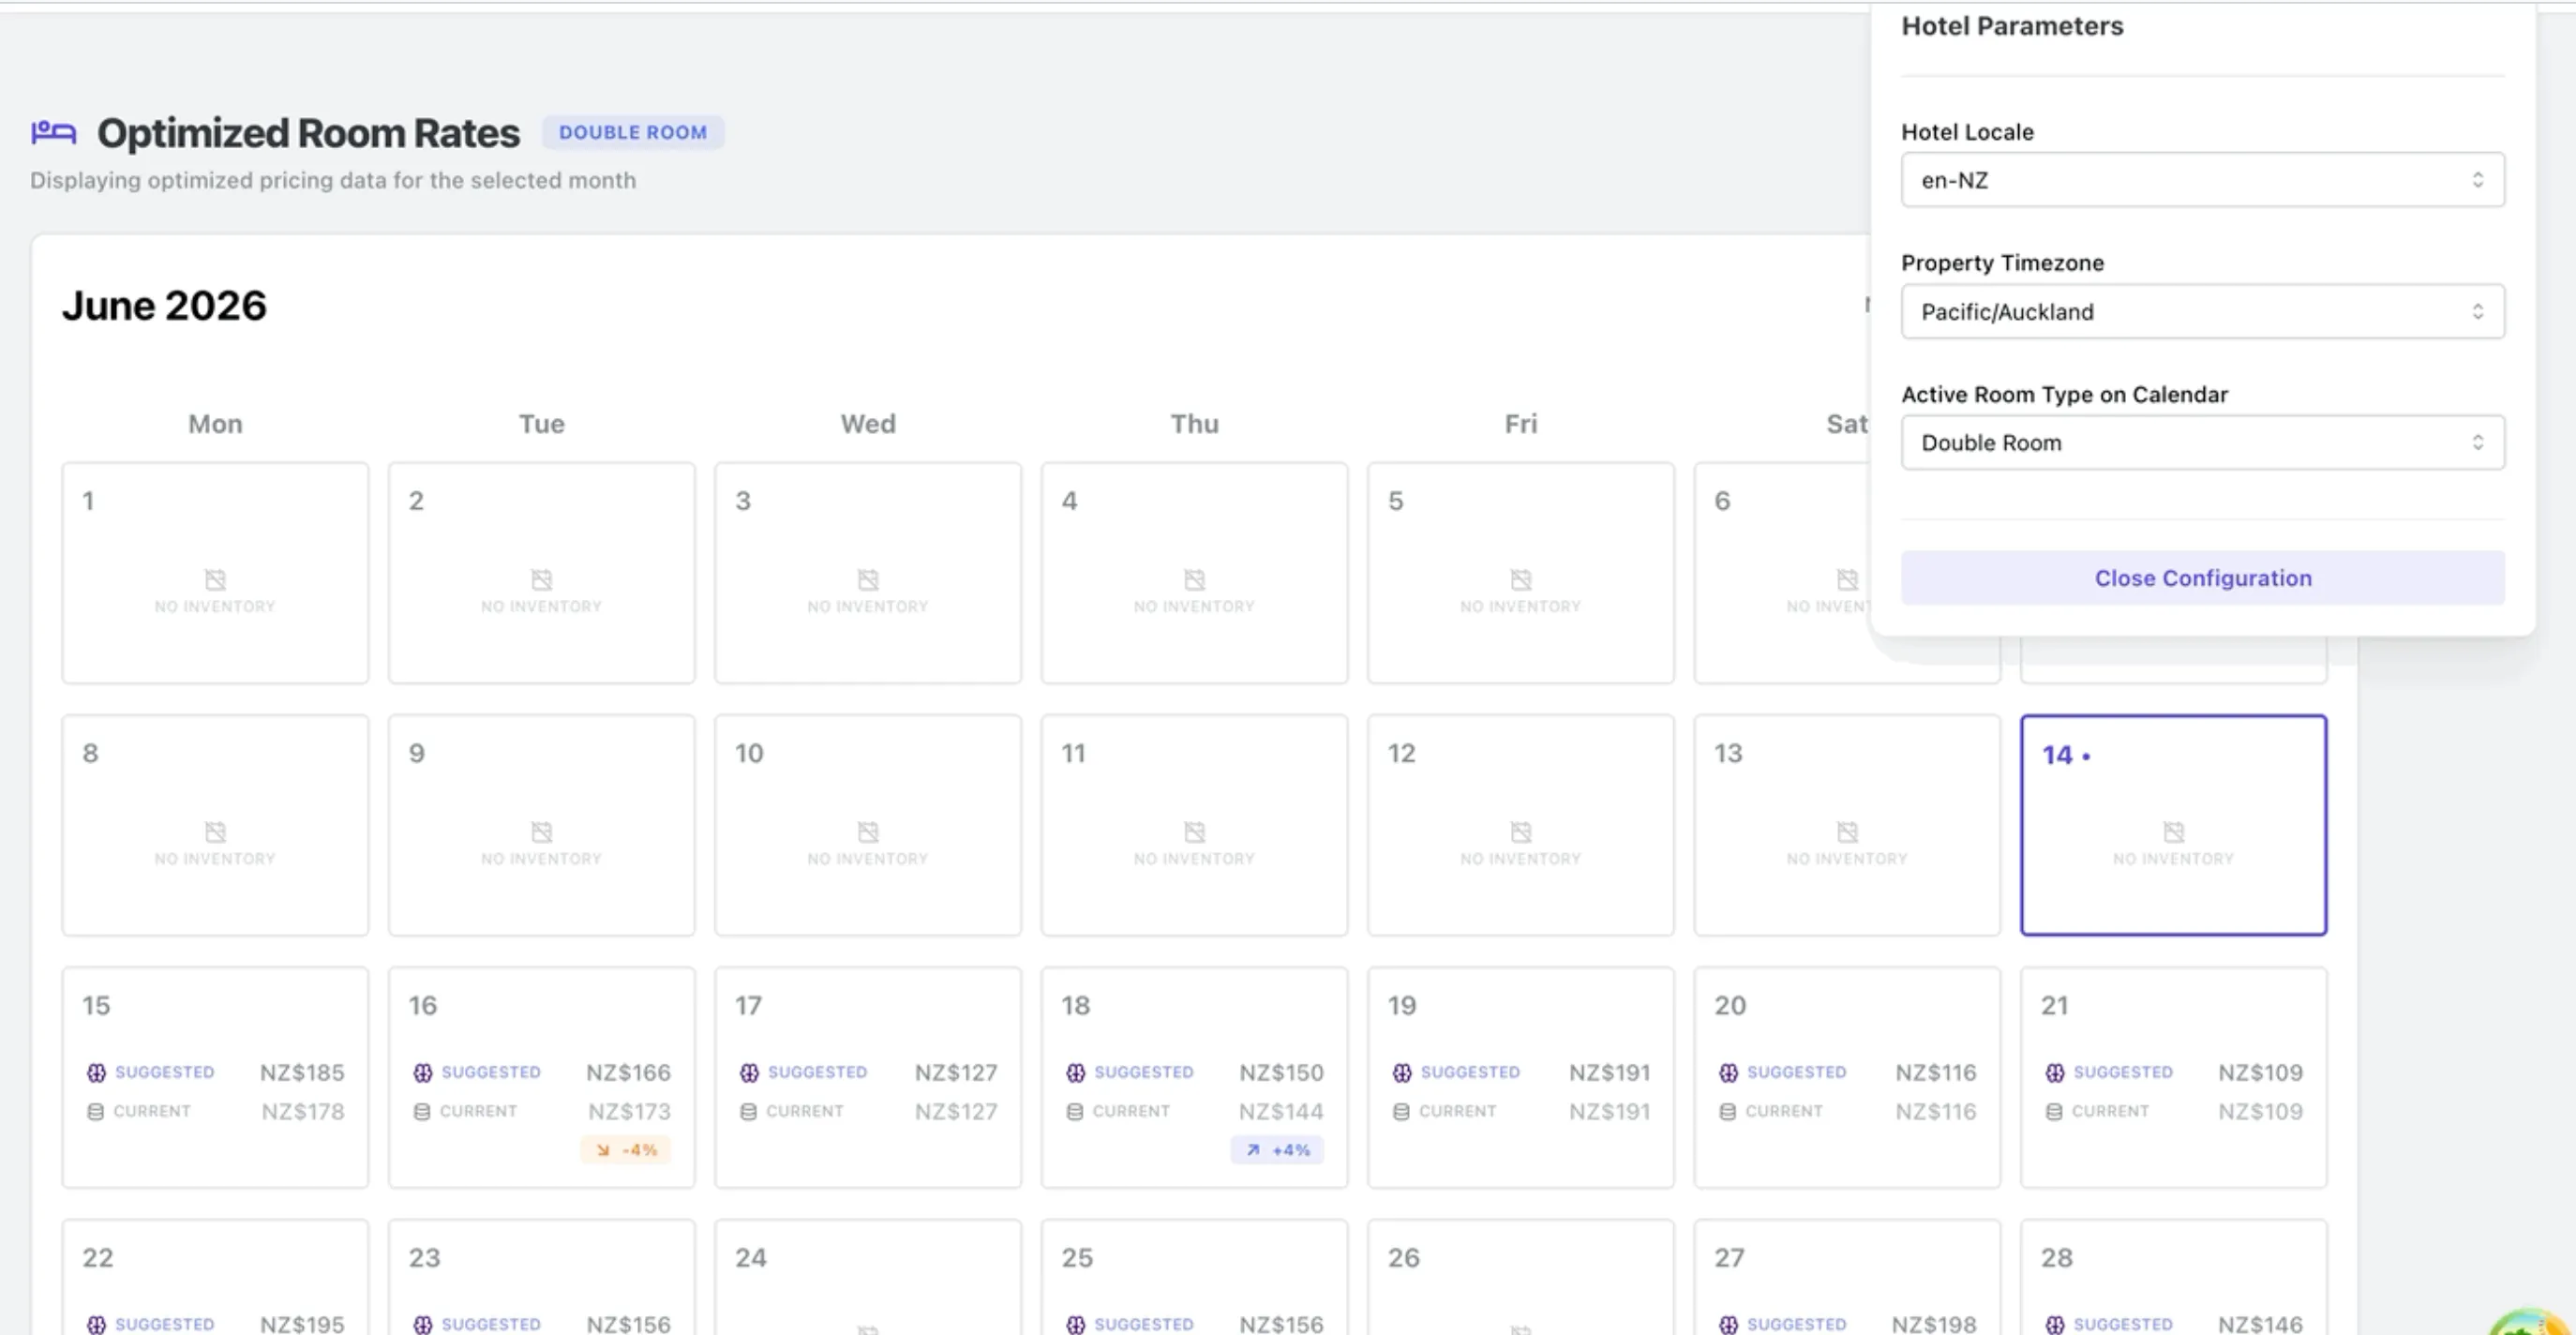
Management System Pricing Calendar simulation with React, TypeScript, and TanStack Query
An interactive Revenue Management simulation featuring real-time dynamic rates visualization. Built on a decoupled full-stack architecture powered by a high-performance API server and reactive data flows.
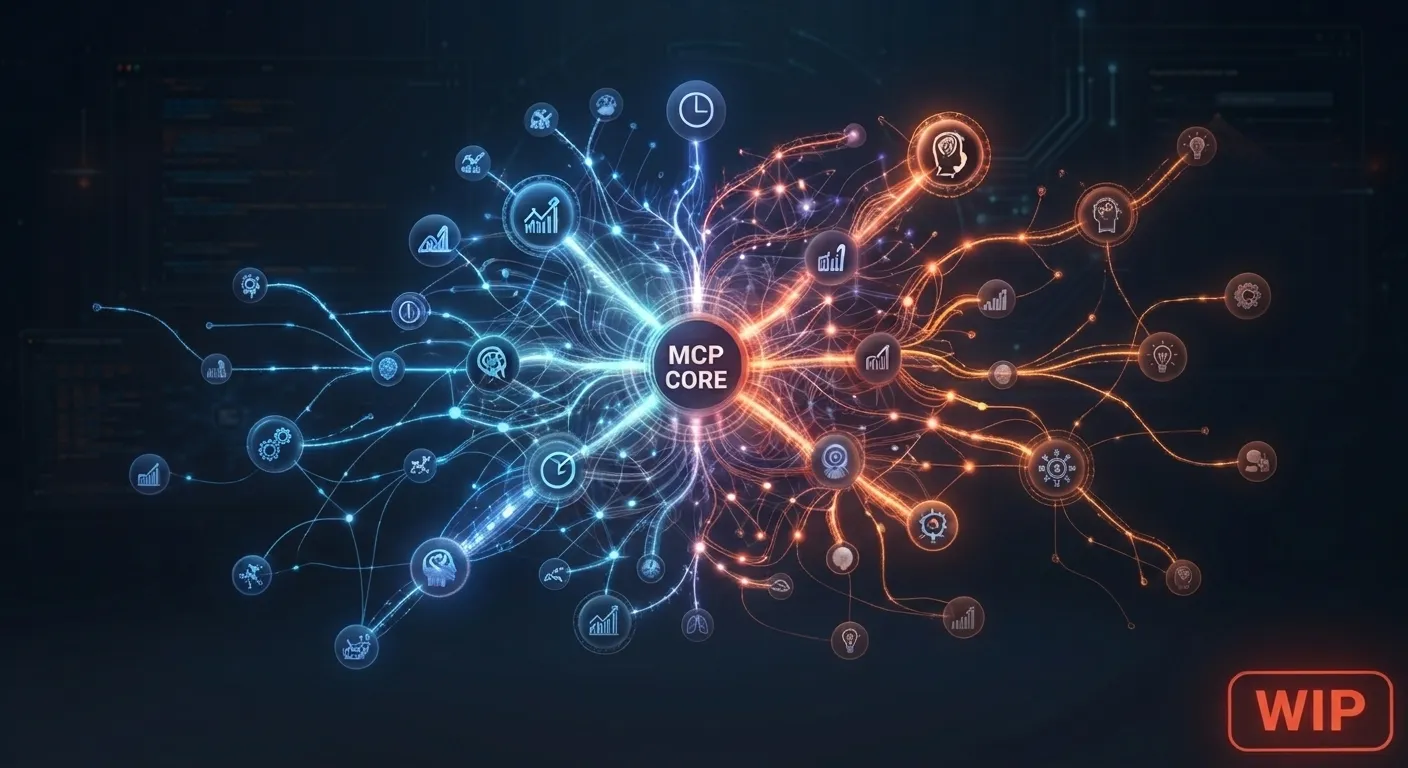
Semantic Knowledge Graph MCP Server
Independent MCP server that builds deterministic semantic knowledge graphs for projects. Designed as a lightweight plugin that integrates with multiple AI agents without modifying core systems. Focused on structured project understanding, timelines and graph outputs for visualization.

Type-safe GraphQL API (Domain-driven)
Production-oriented GraphQL API built with TypeScript, Apollo Server and a modern ORM. Features strong end-to-end type safety, custom scalars, optimized data loading patterns, automated documentation and an experimental natural-language query layer.

Cognitive Usability Analysis Tool
Experimental command-line tool inspired by cognitive usability principles. Analyzes web interfaces from a human-centered perspective to help identify friction points and improve clarity. Currently in early development.